K4LRG 2007 ARRL Field Day
Another Fine Business Operation By The
Loudoun Amateur Radio Group
de Loudoun County, Northern Virginia


--- All THE NUMBERS ---
|
K4LRG 2007 ARRL Field Day |
|
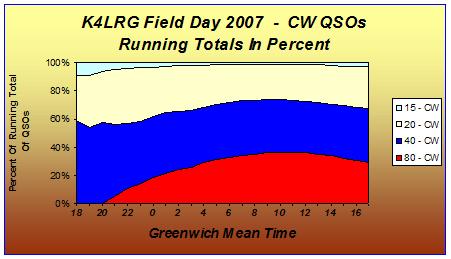
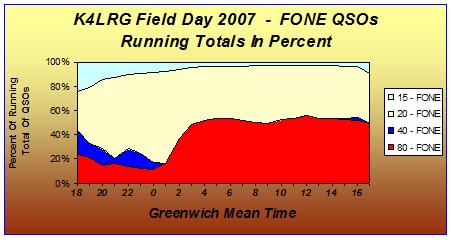
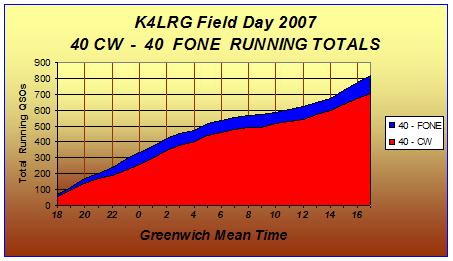
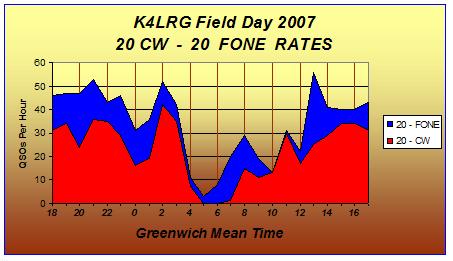
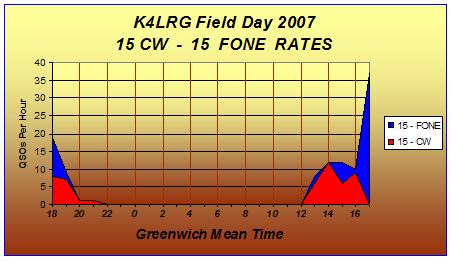
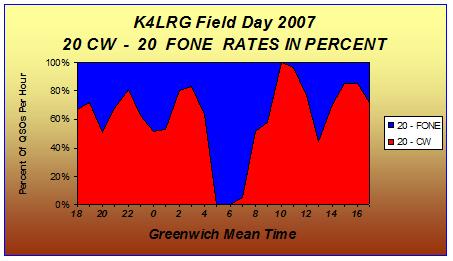
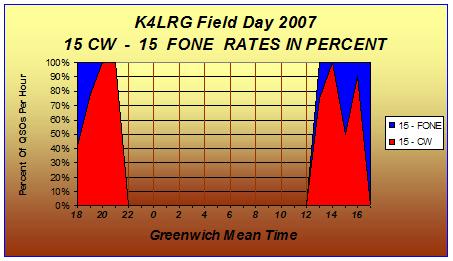
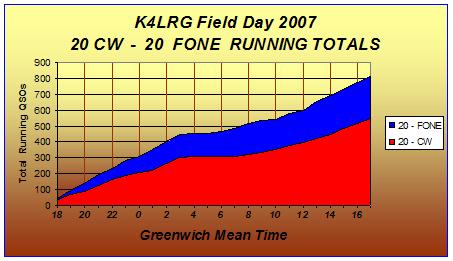
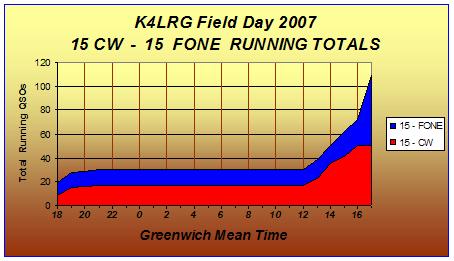
------------------------------------------------------      The CW vs Fone Battle The CW vs Fone Battle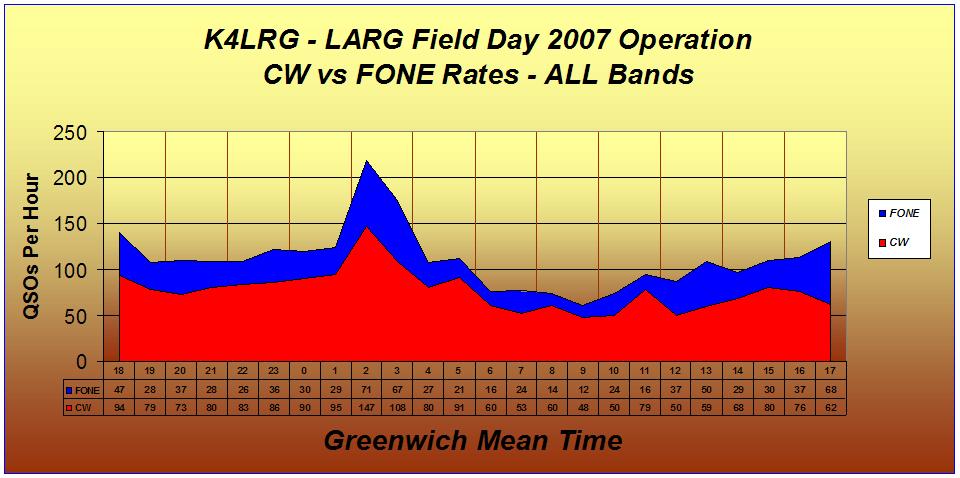 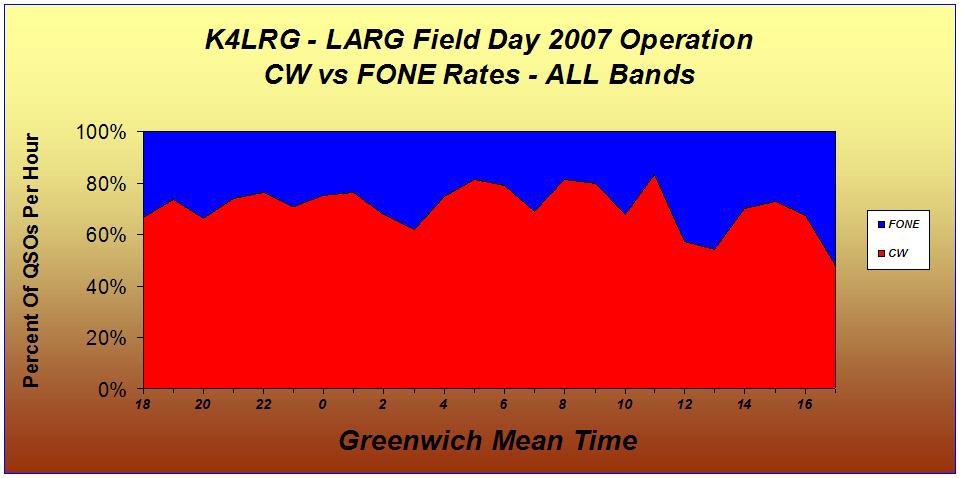 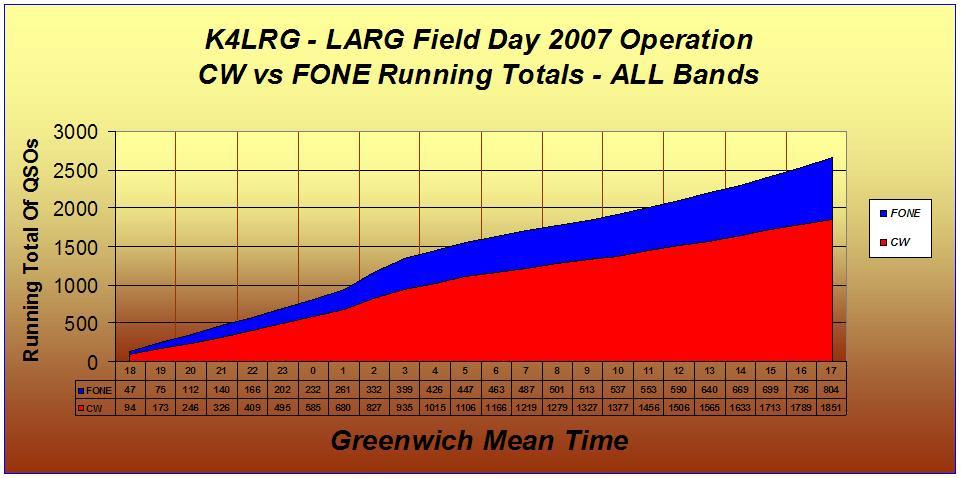 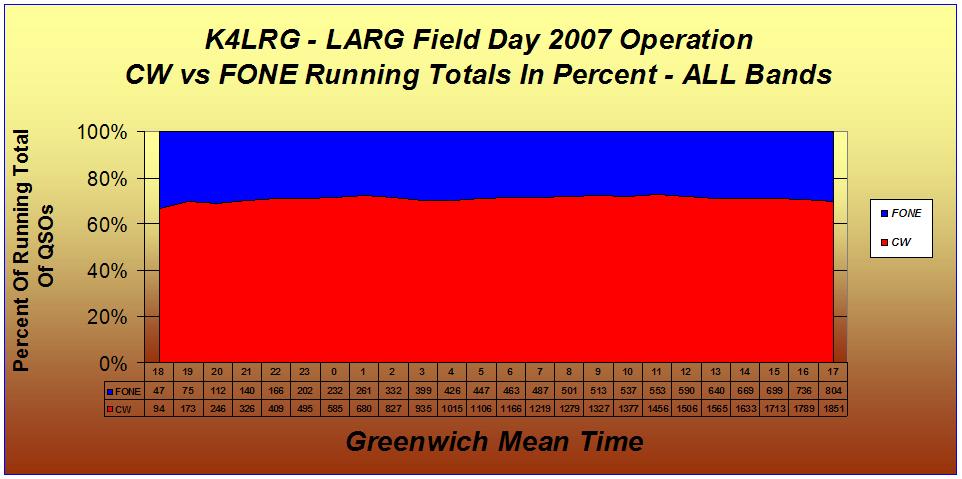 |
|
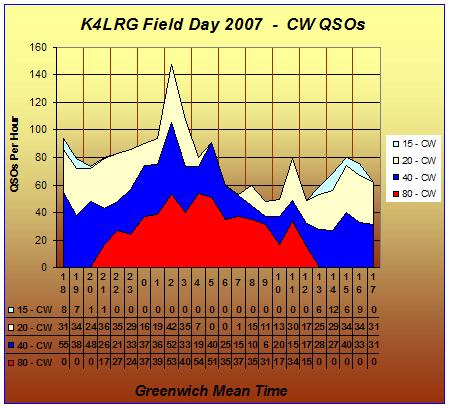
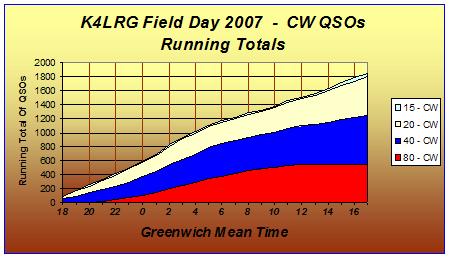
Dancin' With Charlie Whiskey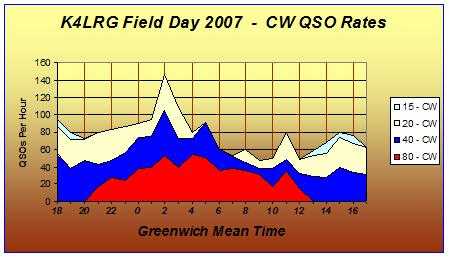 |
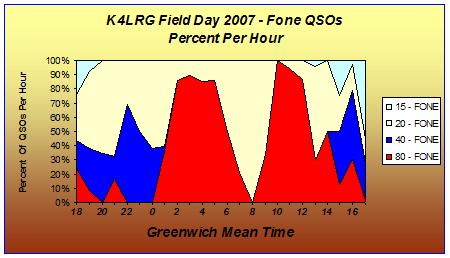
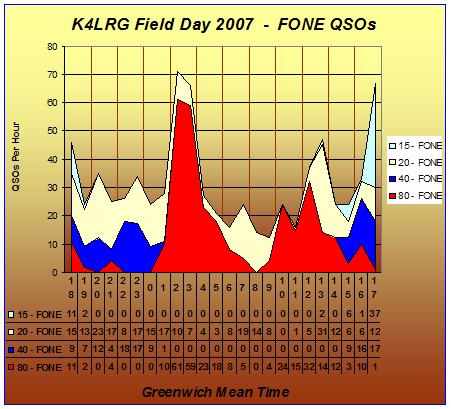
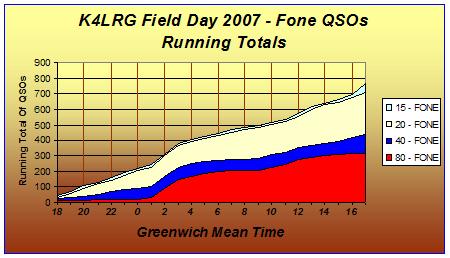
How About A Little Fone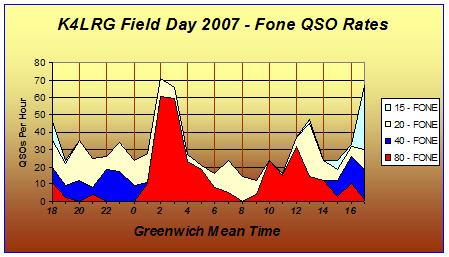 |
 |
 |
 |
 |
 |
 |
 |
 |
|
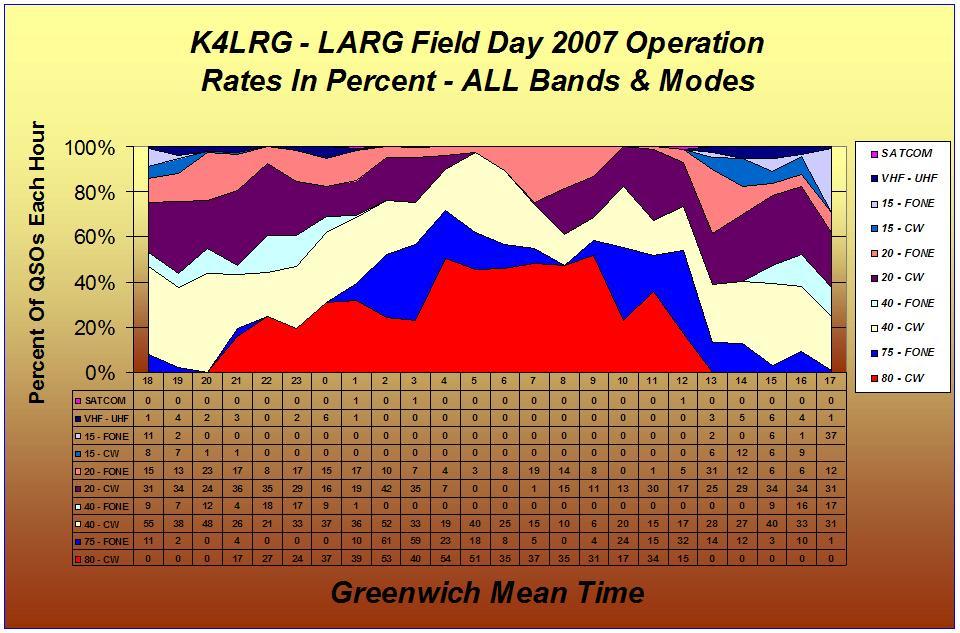
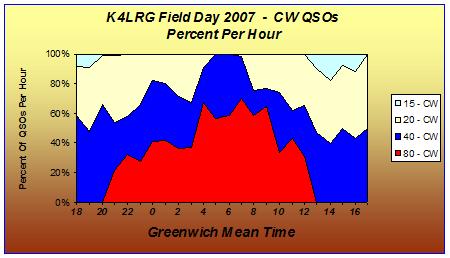
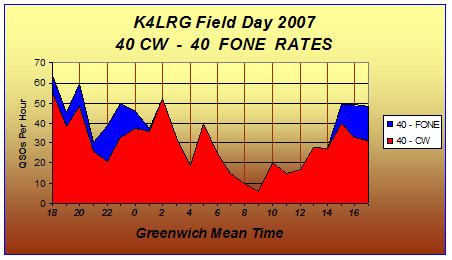
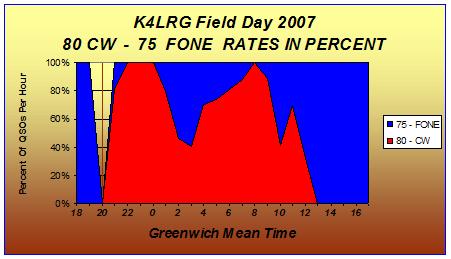
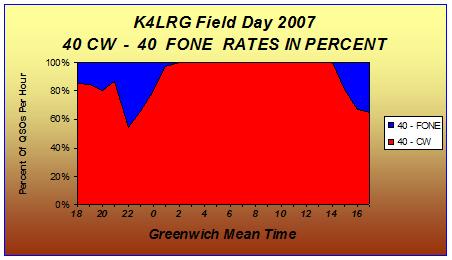
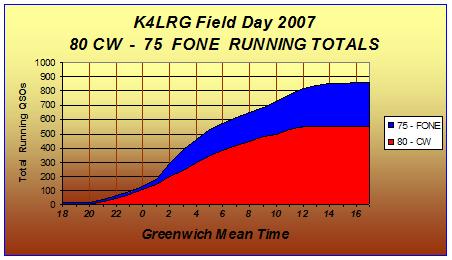
CW vs Fone Operations On Each Band |
|
 |
 |
 |
 |
 |
 |
 |
 |
 |
 |
 |
 |
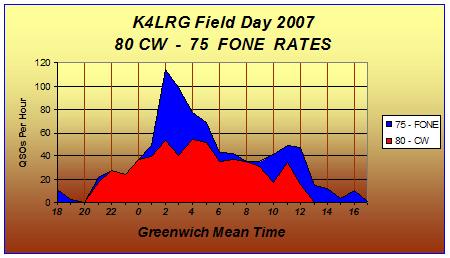
The Low vs High Band Battle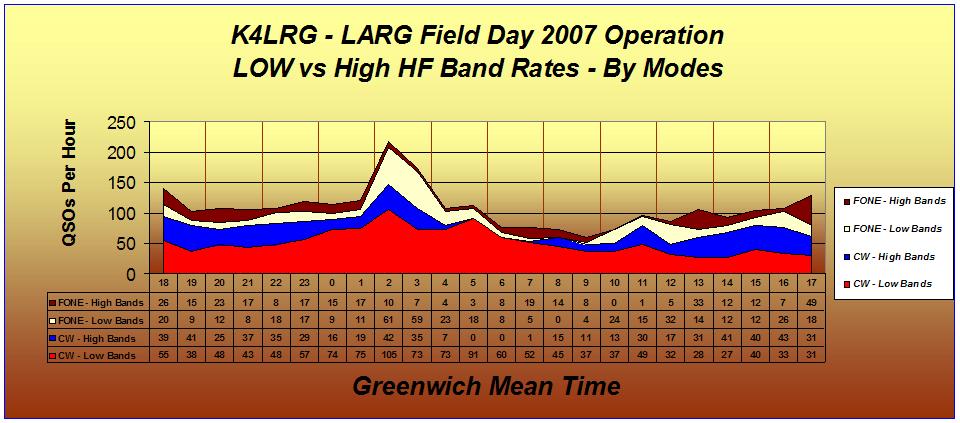 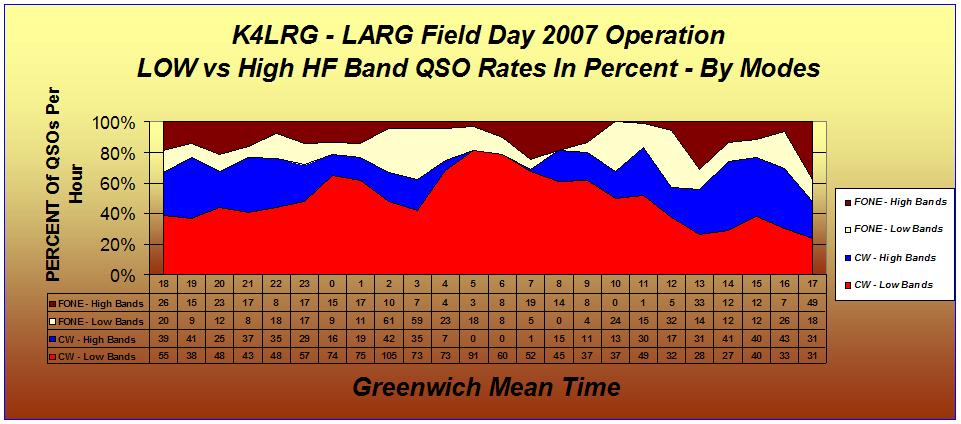 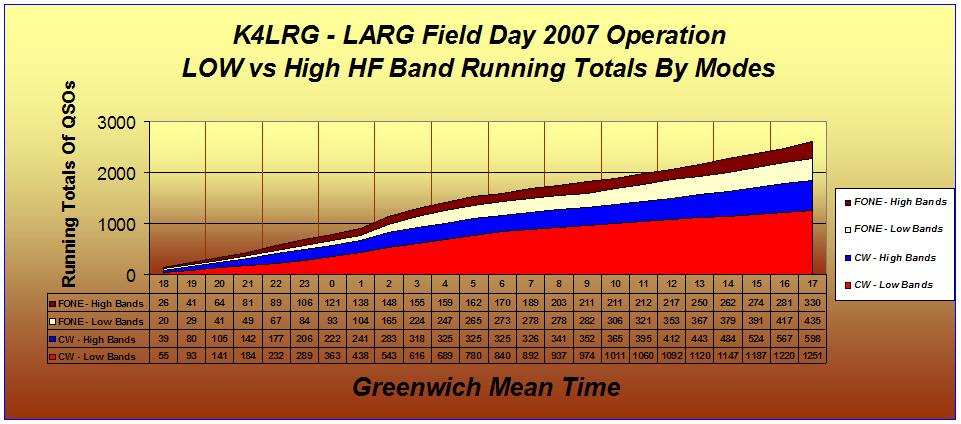 STATION PERFORMANCE
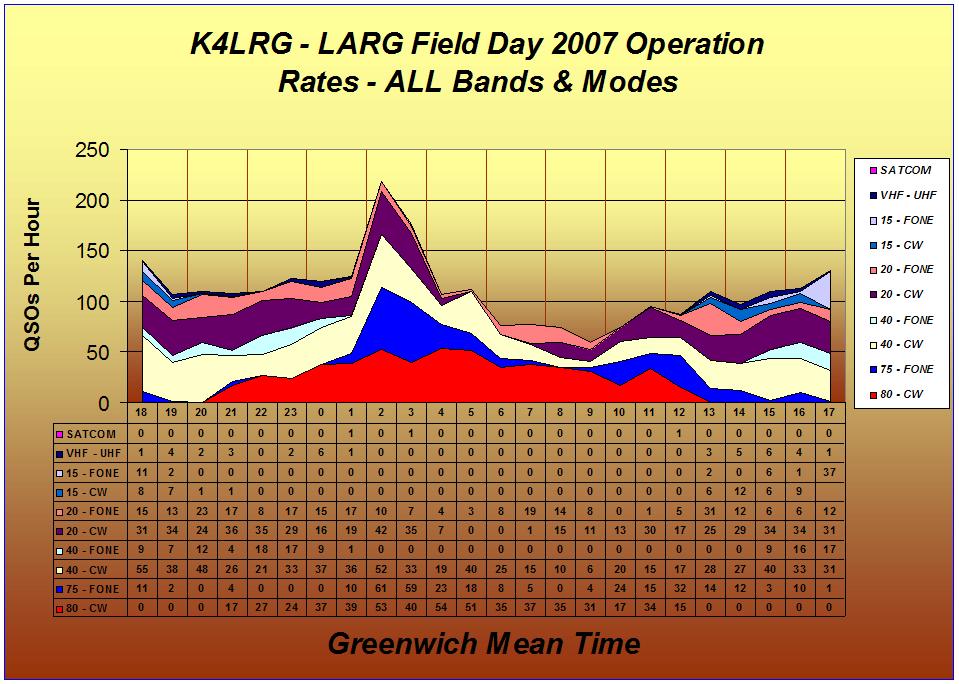
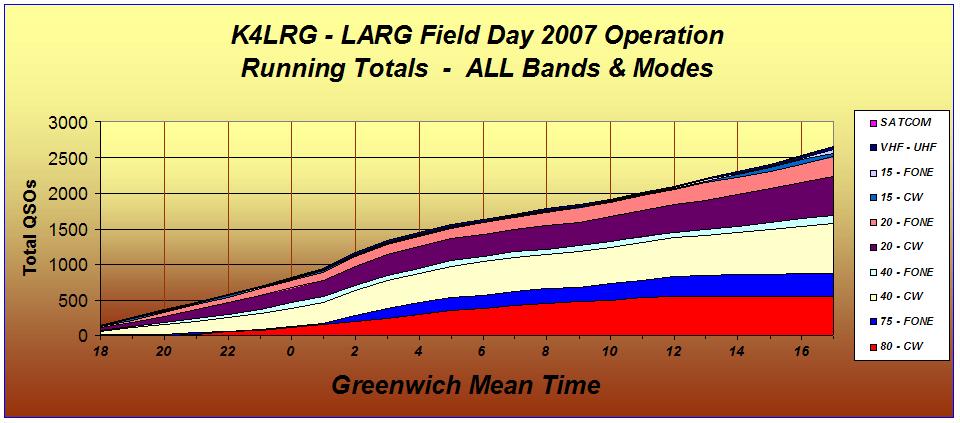
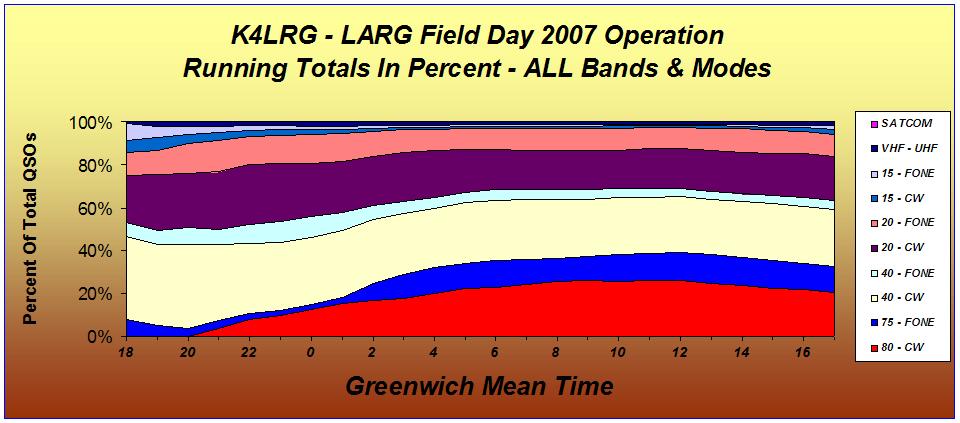
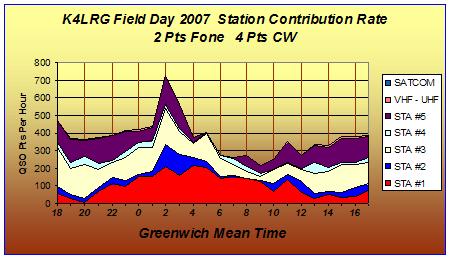
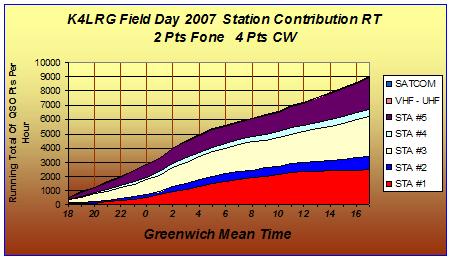
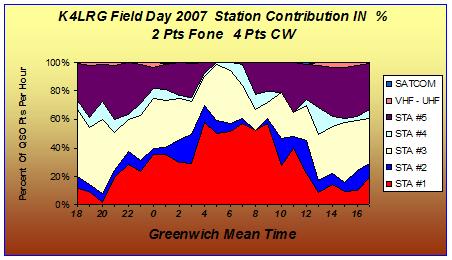
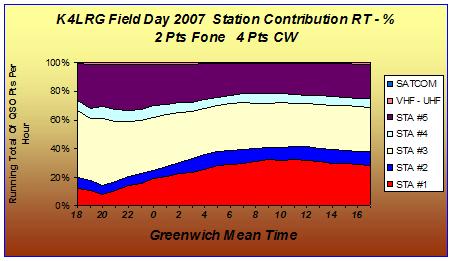
So, how well did your station perform. These charts count partial and full hours times. So, if you made one contact at 5-minutes past the hour then the 'whole' hour got counted. Yes, maybe a little unfair but the numbers come out pretty good in the 'wash.' Stations #1 and #2 get looked at for their several different band operations. The first chart is their average hourly QSO rate. The second chart, shows their time on each band-mode. The key here is to know where and when to operate. Dead bands or dead stations don't help! 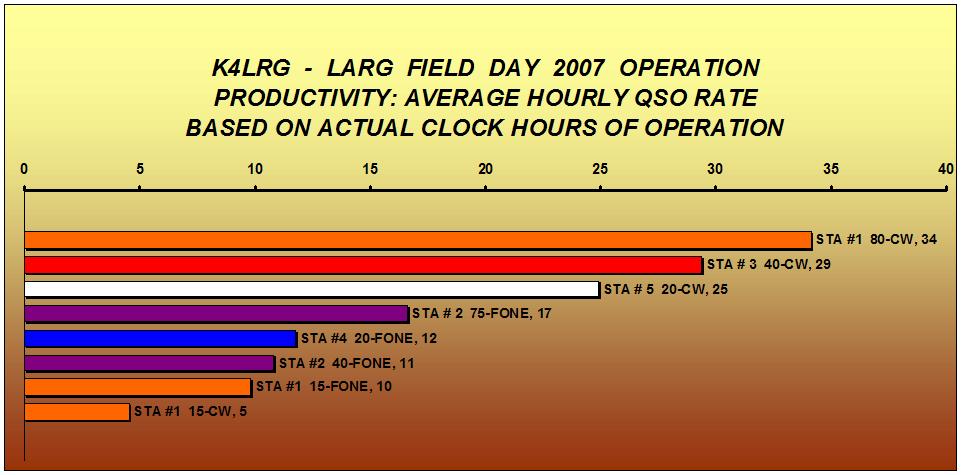 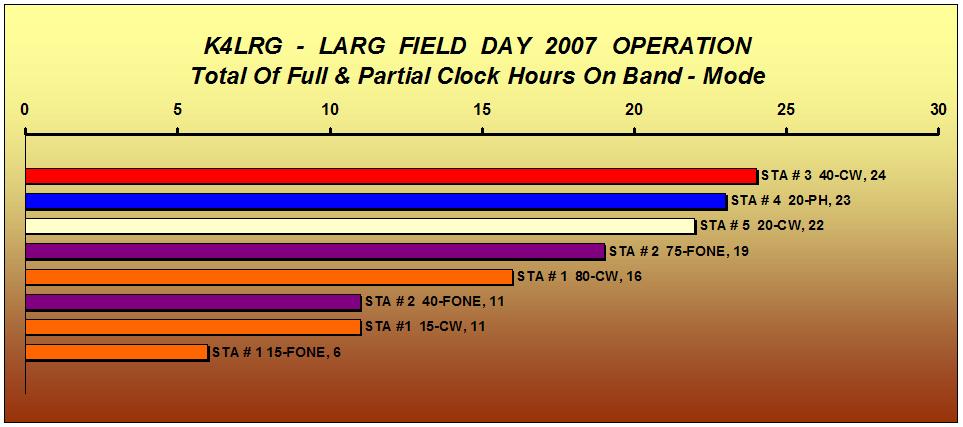 Contributions To The Final Score Contributions To The Final ScoreOur final score is based on one point for a Fone and two points for a CW QSOs. This is further increased by a multiplier of two for operating at 150 watts or less. So, the ranking are Station #3, Station #1 followed by Station #5. All are dedicated to CW. |
|
 |
 |
 |
 |
|
Check Yourself - Can we improve ? Don't stop now. The checks below first appeared in our 2006 Field Day report. It's repeated here for those who thought they struggled and for the regulars who need reminding. I hope this helps. | |
Can you find when and where you operated? |
Did you copy the full call the first time? |
This report is written, edited and posted to the Loudoun Amateur Radio Group's K4LRG.ORG Internet Site by Norm Styer - AI2C of Clarkes Gap, Virginia. For photographic credit place your cursor over a photograph. Non-profit use of this material is granted if the Loudoun Amateur Radio Group of Northern Virginia, its internet writers, photographers and publishers are credited. Best regards, Norm Styer - AI2C. |