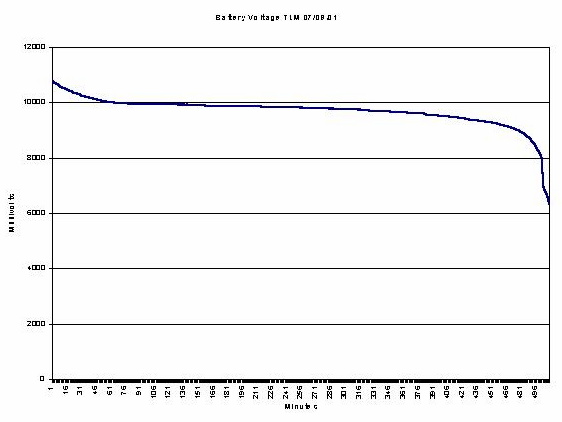
The Battery voltage looks like a classic discharge curve.
.

Pressure looks like it drifts a little with the increase in bus temperature.
.
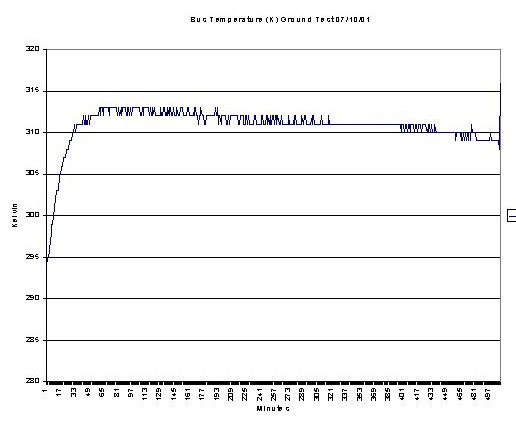
Bus temperature increase due to the power
dissipated in the linear voltage regulators.
This heat is used to keep the bus warm.
.
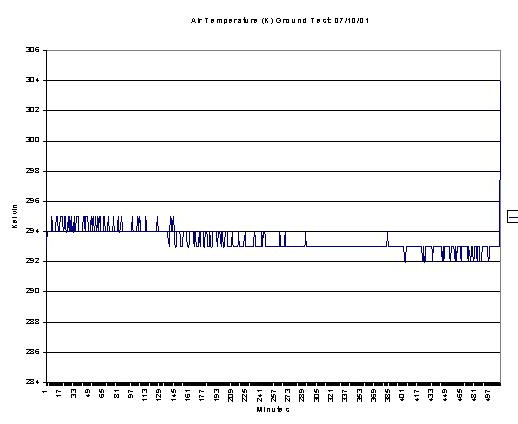
Air temperature is what you'd expect.
The "noise" in the temperature data is due to the 1 bit uncertainty in digitizing
anything.
NNNN